INTRODUCTION
The Alabama coal industry and its supporting suppliers currently employ over 3,000 full-time- equivalent (FTE) employees and generate approximately $370 million in annual payroll. The industry average payroll is well over $100,000 per annum, making it one of the highest paid industries in Alabama, 1.6 times greater than average gross salaries in the state.
Alabama is ranked 14th in total coal production and 8th in bituminous coal production in the U.S. The overall coal production in 2018 was estimated to be approximately 13.5 million short tons. Met coal production accounted for 11 million tons or 82 percent of the state’s coal production, while thermal coal made up the remaining 2.5 million tons or 18 percent of overall production.
Coal has been mined commercially in Alabama since the 1850’s. In early years, coal was the single most important natural resource assisting in the transition of Alabama’s economy from an agriculturally-based to an industrialized economy through supporting the state’s development of the iron and steel industry. Later, coal mining was the catalyst in making Alabama become an energy producing and export-based economy.
Coal is the largest and most widespread fossil fuel resource. It accounts for 23 percent of the world’s known energy sources.6 Based on the “Demonstrated Reserve Base” data, Alabama holds about 4 billion tons of economically recoverable coal reserves. Using the EIA data, we estimate that 85% of that reserve is met coal. At Alabama’s current rate of met coal production – 11 million short tons per year in 2018- the state’s met coal resources will last for another 309 years, making it Alabama’s most lasting fossil fuel resource.
Alabama’s five bituminous coalfields are listed below. Most of the state’s 23 active surface and underground coal mines are located in the Warrior Coalfield. The top coal-producing counties in 2018 were Tuscaloosa, Jefferson and Walker.
- Cahaba Coalfield (St. Clair, Jefferson, Shelby, and Bibb Counties)
- Coosa Coalfield (St. Clair and Shelby Counties)
- Lookout Mountain Coalfield (Dekalb, Cherokee, & Etowah Counties)
- Sand Mountain Coalfield (Jackson, Dekalb, Etowah, Marshall, and Blount Counties)
- Warrior Coalfield (Jefferson, Tuscaloosa, Fayette, Walker, Winston, and Marion Counties)
METALLURGICAL COAL (IMAGE)
Met coal worldwide is less abundant and more valuable than thermal coal. Alabama’s met coal contains very low sulfur and has strong coking properties, making it ideally suited for steel makers. Around 70% of global steel production is dependent on met coal. Most of the met coal mined in Alabama is exported to steel makers in Europe, Asia, and South America via the Port of Mobile.
Three companies — Warrior Met Coal, Peabody Energy, and Murray Energy Corp — produce over 95 percent of all met coal mined in Alabama. One mine, Warrior Met Coal’s Mine #7, is responsible for 43 percent of the state’s total 11 million tons of met coal production. The dollar value of the met coal produced in Alabama during 2018 is estimated at $2 billion.
In 2018, 2,050 Alabamians were directly employed by the state’s met coal producers, which generated an annual payroll of approximately $288 million. Today, the average starting salary for an underground miner in the state’s met coal industry is $85,000 and increases to more than $100,000 after the first two years on the job.10 The United Mine Workers of America (UMWA), a labor union that advocates for the safety and health of its members, represents miners who are employed by each of the state’s three major met coal producers.
Modern coal mining is a stark contrast from the historical photographs that often shape the profession’s public image. Today, each of Alabama’s underground met coal mines utilize safe and highly efficient longwall mining technology, which require a skilled workforce of miners to operate and maintain. A state-of-the-art, fully automated longwall mining system costs around $100 million and consists of self-advancing hydraulic ceiling supports called shields, which extend over 1,000 ft when assembled, a shearer that cuts a thin layer from face of the coal seam with each pass, and a plow system that moves the coal onto a conveyor system and takes it out of the mine. Longwall mining requires a team of engineers and highly skilled miners to support high-voltage electrical power distribution, maintain complex hydraulic systems, and install the dynamic mine ventilation systems that isolate and remove methane and dust during the mining process.
The state of Alabama has taken note of the high-paying skilled jobs provided by the met coal industry. The legislature appropriated $950,000 in the state’s 2020 Education Budget to expand the mine training center located at the Sumiton campus of Bevill State Community College.
The economic impact of Alabama’s met coal industry extends far beyond the mine. The export of met coal drives economic development at the Port of Mobile. In 2018, Mobile ranked fourth in the nation for shipping U.S. coal exports and first in handling coal imports. The McDuffie Coal Terminal generates approximately 50 percent of the total annual revenue earned by the Alabama State Port Authority. Additionally, 777 full-time jobs, with an average salary of $93,000, are supported by coal operations at the Port of Mobile and the transportation of met coal to the port via both railroad and inland waterway.
THERMAL COAL
Thermal coal, also called steam coal, is a more abundant form of coal that is used to generate electricity and an industrial heating source. Around 50 percent of the 2.5 million tons of thermal coal produced in Alabama during 2018 was used to generate electricity within the state. The remaining 50 percent of Alabama’s thermal coal production was used throughout the state for the manufacturing of cement, lime, paper, and chemicals.
In 2018, Alabama’s surface mines, which produced 88 percent of the state’s thermal coal, directly employed 528 full-time employees and generated an annual payroll of approximately $59 million. In addition to these direct jobs, surface mining operations are capital intensive in nature and have a large local multiplier effect since they depend on a large fleet of specialty equipment and typically utilize local third-party vendors to provide blasting services, fuel, equipment maintenance, engineering support, and other professional services.
Today, only about one-fifth of the coal used in Alabama for power production is mined in the state.13 The share of locally mined Alabama thermal coal used for in-state power production declined significantly following the 1990 amendments to the Clean Air Act, which shifted the demand to lower sulfur coal. Modern coal-fired power generating units employ a suite of advanced emission control technologies that have allowed coal to remain a key part of Alabama’s diversified energy portfolio.
All of the locally mined thermal coal used for in-state power production is sold through the Alabama Coal Co-op, which allows smaller, family-owned mining operations to blend their coal and compete against larger out-of-state producers. The Co-op directly supports around half of the state’s 528 surface mining jobs, most of which are located in rural mining communities.
ECONOMIC IMPACT – METHODOLOGY
The methodology employed to estimate the impact of the coal industry (the Industry) on the economy of Alabama, is derived from regional economic models. The basic premise is that the spending by the Industry stimulates various sectors in the economy. First, the transaction activities originated due to the Industry spending increase the demand for goods and services in the local economy. Next, the affected sectors increase their demand from their suppliers throughout the region to respond to the demand for their products.
Classifying the impacts into three broad categories facilitates an understanding of how an initial change in the demand for goods and services, on the economy, due to an economic activity, is multiplied into additional impacts.
THE THREE CATEGORIES OF IMPACTS ARE:
Direct: The direct impact of spending by the Industry is the additional demand and expenditures in the economy that are directly attributable to the regular and day-to-day operation originated by various activities of the Industry.
Indirect: To the extent that direct purchases of goods and services associated with the Industry’s spending reverberate throughout the economy and result in further increases in business transactions, there will be indirect impacts. An indirect impact, for example, results when a business needs additional construction materials and labor to service the increased demand directly attributable to the operation of the Industry. The suppliers of these items find their sales increasing and, in turn, need more input to meet the new demand. This process continues, yielding a multiplied effect on the output of the state economy. Whenever the extra demands are met by industries, outside the local economy, there are leakages from the flow of products and income from the local economy. The greater the number of leakages, the lower the indirect impacts, and the lower the multiplier. On the other hand, the more diversified the local economy, the higher the value of multipliers.
Induced: Additional indirect effects are induced by the change in income in the economy. For example, when a business hires an additional worker to meet the demand caused by the Industry, the worker’s spending further enhances economic activity in the region.
Determining multipliers for the projects under consideration is a fundamental step toward conducting an economic impact analysis. The term multiplier refers to the ratio of all direct, indirect, and induced effects to the direct effects. Once the total direct impact of the Industry’s spending – specifically, earnings, employment, and output directly attributable to – are estimated, they are linked to other relevant criteria to estimate the pursuant demand on housing, labor force, and any addition to sales tax, property tax, and income tax revenues realized by the state officials.
For the purpose of estimating the economic impact of this project, economic, demographic, and housing market information were gathered from:
The U.S. Department of Labor
The U.S. Census Bureau
The U.S. Bureau of Economic Analysis
Alabama Department of Revenue
Economic Development Partnership of Alabama
DIRECT DATA
Direct data for conducting this study was collected from the primary sources and through conducting a survey of the Alabama Coal Association membership. More specifically, direct production and employment figures for fiscal year 2018 were collected from “The Annual Report Statistical Supplement of the Department of Labor, Mining and Reclamation Division, Mine Safety and Inspection Section, FY 2018, State of Alabama”. Based on this report and as reported in Table 1, in 2018, there were six active met coal and 15 active thermal coal mines in Alabama. These mines produced 13.5 million tons of coal and employed 2,578 FTE employees. Met coal accounted for 11 million tons or for 82% of the production and the thermal coal production totaled 2.5 million tons or 18% of the total production. The dollar value of met coal and thermal coal productions are estimated at $2 billion and $190 million, respectively, in 2018. The total dollar value of production is estimated at approximately $2.22 billion which constitutes about 1% of Alabama’s total Gross Domestic Product (GDP). In terms of FTE employment, met coal was responsible for 80% of the employment and the remaining 20% were employed in thermal coal mining activities.
Total Mining Production and Employment
| Year | Employment | Production in Tons | |
|---|---|---|---|
| Underground | 2018 | 2,050 | 11,033,902 |
| Surface | 2018 | 528 | 2,453,276 |
It is important to note that the figures presented in Table 1 account for direct aggregate coal mining production and employment only and do not include any detailed spending or any information regarding industries that directly support production or transportation of coal in Alabama. In order to obtain this information, we conducted a survey of the members of the Alabama Coal Association and their affiliated (supporting) firms. The results are reported in Tables 2 through 11.
Met or Underground Mines
| Year | Employment-FTE | Payroll | Non-payroll | Total Spending | Capital Investment |
|---|---|---|---|---|---|
| 2017 | 1,765 | $223,945,958 | $498,152,807 | $722,098,765 | $99,222,252 |
| 2018 | 1,767 | $248,250,855 | $566,278,303 | $814,529,158 | $107,945,171 |
Thermal or Surface Mines
| Year | Employment-FTE | Payroll | Non-payroll | Total Spending | Capital Investment |
|---|---|---|---|---|---|
| 2017 | 414 | $45,091,581 | $102,527,362 | $147,618,943 | $421,600 |
| 2018 | 434 | $49,198,368 | $105,090,947 | $154,289,315 | $9,179,930 |
Underground and Surface Mines
| Year | Employment-FTE | Payroll | Non-payroll | Total Spending | Capital Investment |
|---|---|---|---|---|---|
| 2017 | 2,179 | $269,037,539 | $600,680,169 | $869,717,708 | $99,643,852 |
| 2018 | 2,201 | $297,449,223 | $671,369,250 | $968,818,473 | $117,125,101 |
About 50% of the met coal producers and 40% of the thermal coal companies in Alabama responded to our survey. Based on our sample, met coal mining employed 1,767 FTE employees and spent a total of $815 million in payroll and non-payroll expenditures in 2018. Thermal coal companies employed 434 people and spent a total of $154 million in 2018. Together, our sample of met and thermal coal companies indicated a payroll spending of $297 million and a non-payroll spending of $671 million in 2018. In addition, these companies recorded a total $117 million in one-time capital spending. The aggregate direct spending by the coal producers in 2018 is reported to be $1.1 billion. Our research shows that met coal mining companies were responsible for 84% of total coal mining spending in Alabama in 2018.
Our sample represent 86% of total reported employment of industry by the State’s Mining and Reclamation Division in 2018 for met coal and 82% of the total employment for the thermal coal miners. Next, we tallied the same statistics for the direct supporting industries of the coal mining in Alabama. The results are reported in Tables 5 through 7.
Suppliers – Underground Mines
| Year | Employment | Payroll | Non-payroll | Total |
|---|---|---|---|---|
| 2017 | 347 | $32,797,125 | $73,226,014 | $106,023,273 |
| 2018 | 414 | $35,832,273 | $80,876,615 | $116,708,888 |
Suppliers – Surface Mines
| Year | Employment | Payroll | Non-payroll | Total |
|---|---|---|---|---|
| 2017 | 393 | $37,196,739 | $83,049,168 | $120,245,907 |
| 2018 | 469 | $40,639,041 | $91,725,917 | $132,364,958 |
Suppliers – Underground and Surface Mines
| Year | Employment | Payroll | Non-payroll | Total |
|---|---|---|---|---|
| 2017 | 740 | $69,993,864 | $156,275,315 | $226,269,179 |
| 2018 | 883 | $76,471,314 | $172,602,532 | $249,602,846 |
According to our survey, a total of 883 individuals are employed by direct suppliers of coal mining in Alabama in 2018. These suppliers directed $76.5 million in payroll and $172 million in non-payroll spending in 2018. The met coal producers were responsible for 47% of suppliers’ activities.
The overall industry’s (coal mining and direct suppliers) economic attributes are presented in Tables 8 thru 10. As reported in Table 8, the aggregate industry employment in 2018 was reported to be 3,084. The overall spending in 2018, was at $1.2 billion from which $374 million was payroll. Our research shows an employment growth of 6% and spending growth of 11% from 2017 to 2018. Finally, the underground met coal mining share of activities ranged from 71% of employment to 76% of total spending.
Coal Mining and Suppliers Data
| Year | Employment | Payroll | Non-payroll | Total |
|---|---|---|---|---|
| 2017 | 2,919 | $339,031,403 | $840,004,652 | $1,095,986,888 |
| 2018 | 3,084 | $373,920,537 | $935,697,699 | $1,217,892,319 |
Underground Mines and Suppliers
| Year | Employment | Payroll | Non-payroll | Total |
|---|---|---|---|---|
| 2017 | 2,112 | $256,743,083 | $654,428,122 | $828,122,038 |
| 2018 | 2,181 | $284,083,128 | $738,880,835 | $931,238,046 |
Surface Mines and Suppliers
| Year | Employment | Payroll | Non-payroll | Total |
|---|---|---|---|---|
| 2017 | 807 | $82,288,320 | $185,576,530 | $267,864,850 |
| 2018 | 903 | $89,837,409 | $196,816,864 | $286,654,273 |
Underground Share of Activities
| Year | Employment | Payroll | Non-payroll | Total |
|---|---|---|---|---|
| 2017 | 72% | 76% | 78% | 76% |
| 2018 | 71% | 76% | 79% | 76% |
ECONOMIC IMPACT
Direct economic data are the necessary input for estimating the economic impact of the coal industry. Direct data, in this case, are the economic activities that are solely attributable to coal mining industry.
Direct economic data of the coal mining industry is presented in Tables 12 through 14. To derive these figures, the financial information compiled from the survey research were adjusted using the employment ratio. More specifically, the employment data reported by the Alabama Mining and Reclamation Division was divided by the employment from the survey results. This ratio was then applied to financial expenditures collected from the membership survey.
The estimated direct data figures are reported in Table 12. It is our estimate the coal mining industry produced $2.2 billion worth of coal in 2018. The Industry is estimated to be responsible for $348 million in payroll and 2,578 jobs in the state. Similarly, it is our estimate that the Industry’s direct suppliers produced $248 of output, $76 million of wages and salaries and 883 FTE jobs.
2018 Estimated Direct Impact
| Output | Payroll | Employment | |
|---|---|---|---|
| Coal Mining Industry | $2,216,936,053 | $347,864,566 | 2,578 |
| Coal Mining Suppliers | $249,073,846 | $76,471,314 | 883 |
| Total Direct Impact | $2,466,009,899 | $424,335,880 | 3,461 |
In order to estimate the total economic impact of the coal industry on the state’s economy, the direct economic attributes of the Industry (Table 14) were used in conjunction with an economic model of Alabama.
The model used in this study is constructed by estimating the economic and industrial relationships between different industrial sectors of Alabama using the information collected from the U.S. Department of Labor, the U.S. Census Bureau, the U.S. Bureau of Economic Analysis, the Alabama Department of Industrial Relations, the Alabama Department of Revenue, and the Alabama Department of Finance. More specifically, the industrial inter-relationship in Alabama was constructed using input-output technical multipliers obtained from the U.S. Bureau of Economic Analysis. Furthermore, this information was then linked to demographic and labor force data to establish the link among industrial investments, production, and the resource market in Alabama. Next an income module (circular flow type model) was estimated. This module incorporates the information in the first two modules into income and earning creation mechanism for the Alabama economy. Finally, the income and earnings data were then linked to potential tax revenue collections through a series of income elasticity of various tax sources. Every attempt was made to estimate the elasticity ratios for all the tax sources.
Employment and payroll information was used to estimate the coal industry value added. The value-added estimate was then subjected to detailed inter-industrial multiplier analysis. In general, this model produces the following economic impact statistics:
- Output impact
- Employment impact
- Earning impact
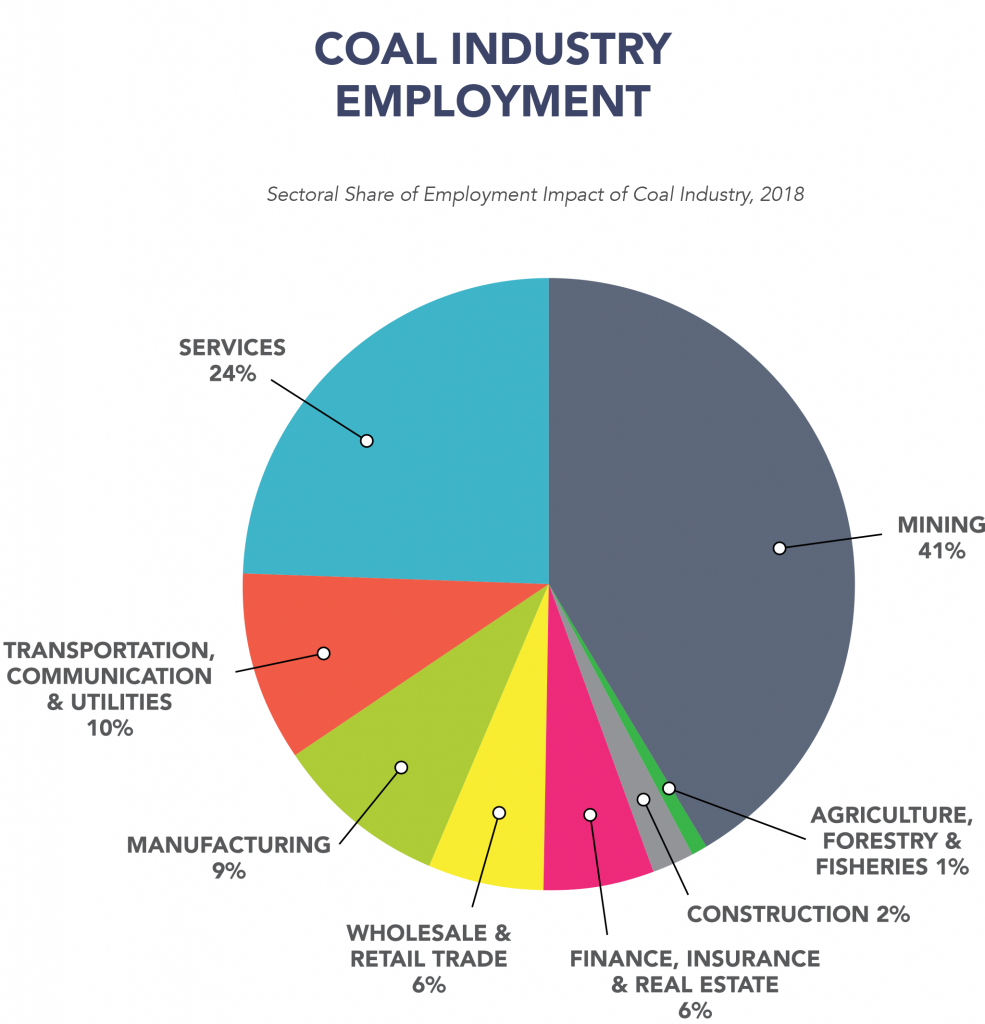
This result of this exercise is presented in Tables 15 thru 17 and Figure 2. According to our model, as presented in Table 15, the employment, output, and earnings impacts of the coal mining industry in Alabama are as follows:
- Total output impact of $2.9 billion
- Total earnings impact of $1.2 billion
- Total employment impact of 15,000 FTE jobs
Total Employment Impact – FTE:
Total Payroll Impact:
Total Economic Impact:
15,144
$1,188,407,854
$2,935,576,106
Next, Table 16 shows the inter-industry interaction between all sectors of the state’s economy and the coal industry. According to our model, the largest beneficiaries of the economic impact of the coal industry are:
- Mining and Suppliers
- Service sector
- Manufacturing sector
- Transportation sector
- Finance sector
- Wholesale and Retail Trade
| Output | Earning | Employment | |
|---|---|---|---|
| Agriculture, forestry and fisheries | $12,684,017 | $3,678,365 | 209 |
| Mining | $1,867,860,961 | $882,012,750 | 6,229 |
| Construction | $26,382,754 | $9,386,172 | 311 |
| Manufacturing | $225,521,814 | $52,511,829 | 1,337 |
| Transportation, communication and utilities | $205,607,908 | $51,700,051 | 1,580 |
| Wholesale and retail trade | $129,985,802 | 57,331,755 | 983 |
| Finance, insurance and real estate | $195,460,695 | $22,704,390 | 840 |
| Services | $272,072,155 | $109,082,542 | 3,655 |
| Total | $2,935,576,106 | $1,188,407,854 | 15,144 |
| Output | Earning | Employment | |
|---|---|---|---|
| Agriculture, forestry and fisheries | 0% | 0% | 1% |
| Mining | 64% | 74% | 41% |
| Construction | 1% | 1% | 2% |
| Manufacturing | 8% | 4% | 9% |
| Transportation, communication and utilities | 7% | 4% | 10% |
| Wholesale and retail trade | 4% | 5% | 6% |
| Finance, insurance and real estate | 7% | 2% | 6% |
| Services | 9% | 9% | 24% |
| Total | 100% | 100% | 100% |
Finally, according to our model, in addition to $5.0 million in coal severance taxes in 2018, the coal industry is estimated to have generated an additional total of $69 million of taxes for the state coffers. These are the category of taxes that we can directly attribute to the operation and spending of this industry. Based on our estimate, the coal mining industry was responsible for $37 million in income taxes, $27 in sales and use taxes, and $5 million in utility taxes. These taxes are net of deduction and collection fees and are net contribution to the state’s Education Trust Fund.